gNMI Telemetry in Practice: TIG, TPG, TICK
gNMI Telemetry Purpose
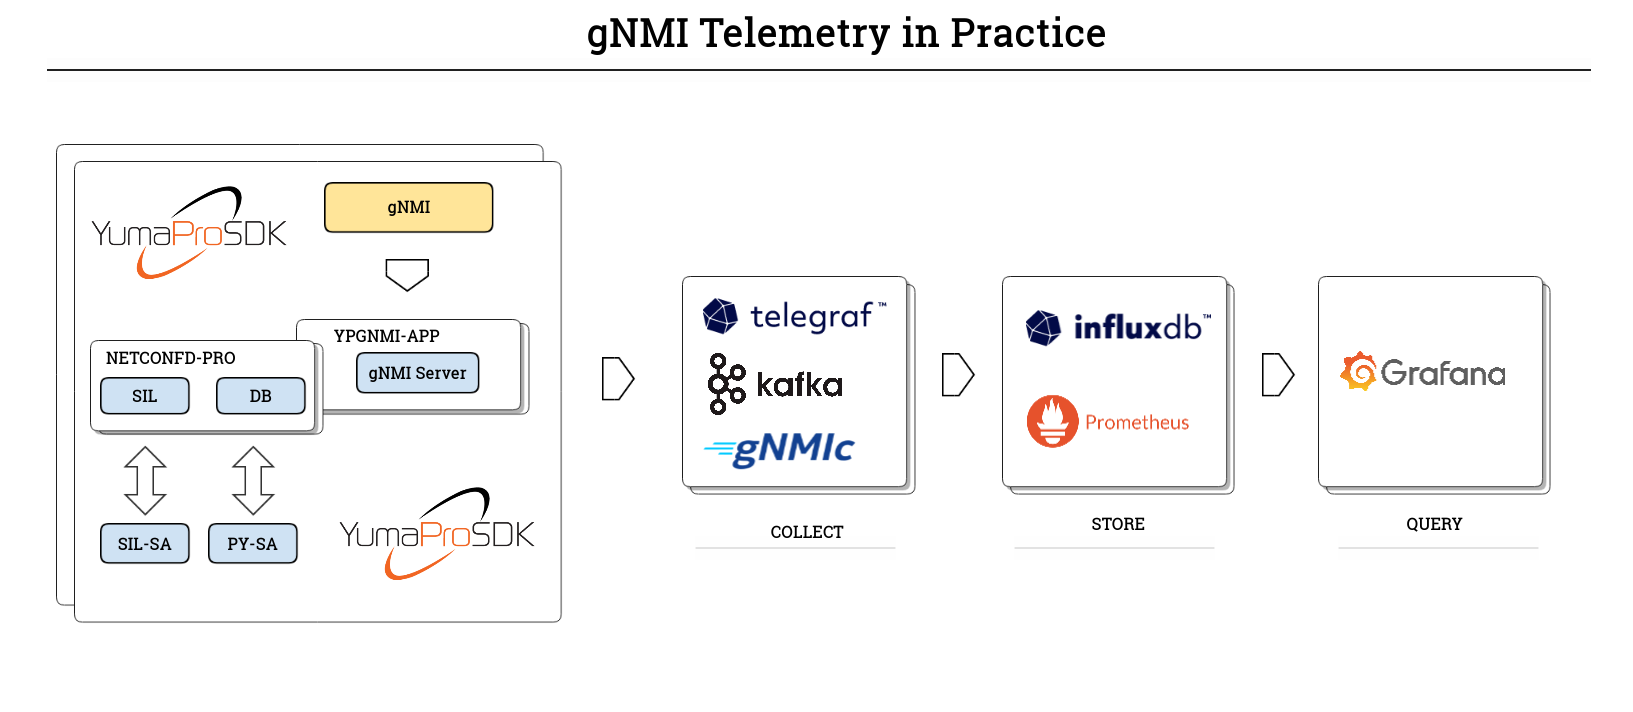
This manual describes how to deploy and operate the Telegraf-centric telemetry stacks to collect, normalize, store, and visualize network telemetry delivered over gNMI. The focus is on model-driven telemetry (MDT) using OpenConfig/YANG paths and on building reliable data pipelines from devices to time-series databases and dashboards.
A successful telemetry and analytics platform collects data from streaming sources, standardizes values and labels, and presents consistent series to downstream systems.
Telegraf serves as the collection and normalization layer; it subscribes to gNMI streams, decorates measurements with tags, and emits data to InfluxDB or Prometheus for visualization in Grafana.
gNMIc Integration can be used in place of—or alongside—Telegraf. It provides first-class gNMI collection plus native outputs for InfluxDB, Prometheus (scrape or remote_write), and Kafka Integration.
gNMI Telemetry Overview
The following stacks share a common collection layer (Telegraf) and differ mainly in storage, query, and alerting components:
(TIG - Telegraf, InfluxDB, and Grafana): push-oriented, schema-flexible time-series with SQL/InfluxQL querying and broad Grafana support.
(TPG - Telegraf, Prometheus, and Grafana): pull-oriented scraping via a Prometheus-compatible endpoint exposed by Telegraf, ideal where Prometheus is already the standard TSDB.
(TICK - Telegraf, InfluxDB, Chronograf and Kapacitor): classic InfluxData suite providing dashboards (Chronograf) and stream/threshold rules (Kapacitor) alongside InfluxDB.
Each stack can run on a single host for lab use or be split across nodes/containers for production. Telegraf's gNMI input supports 'sample', 'on_change', and target_defined modes with encodings JSON, json_ietf, or bytes.
gNMI Telemetry Architecture
Telegraf acts as the gNMI subscriber. ypgnmi-app streams updates based on subscription paths. Telegraf converts each gNMI 'SubscribeResponse' into time-series points: key leaves become tags, leaf values become fields, and timestamps are preserved. Downstream systems store, query, and visualize these series.
For Prometheus-based deployments, Telegraf typically exposes a local
/metrics endpoint for scraping.
Kafka can be inserted between collection and storage to decouple producers and consumers while enabling replay and multi-backend fan-out without altering the query layer.
TIG - Telegraf, InfluxDB, and Grafana
Telegraf collects and normalizes telemetry, InfluxDB handles high write rates and time-series storage, and Grafana provides dashboards and alerting.
This stack is recommended when a push pipeline and InfluxQL and SQL queries are preferred.
Choose TIG when the environment already uses InfluxDB, when flexible retention policies are needed per dataset. Use write-scoped tokens for Telegraf and read-scoped tokens for Grafana, set bucket retention to match compliance and capacity targets, and adopt naming conventions for measurements, tags, and fields to keep cardinality under control.
Key references:
Telegraf
Telegraf is a lightweight, plugin-driven agent for collecting, processing, and forwarding metrics and events. It provides inputs for data collection, optional processors and aggregators for normalization or roll-ups, and outputs for sending data to destinations such as InfluxDB or a Prometheus-compatible endpoint.
For model-driven telemetry, the gNMI input runs a persistent gNMI client, maintains subscriptions in sample, on_change, or target_defined modes, decodes updates in JSON, JSON-IETF, BYTES, or PROTO, and maps path keys to tags and leaf values to fields. This mapping makes telemetry immediately consumable by time-series back ends without device-specific glue code. The agent is designed for low overhead and predictable behavior, can run as a system service or a container, and uses a declarative, file-based configuration model.
Telegraf Installation
Follow the Telegraf Installation Steps for complete installation procedure.
Recommended workflow:
Start from a minimal configuration that includes only the gNMI input and the required output for the stack.
Verify logs show a successful Subscribe and regular updates or on-change notifications.
After validation, place the configuration in the standard location or mount it into the container, set logging preferences in the agent section, and enable managed startup.
For production, harden file permissions on certificates and tokens and enable HTTPS and authentication on downstream services.
Telegraf Configuration
The first step is setting up Telegraf to subscribe to gNMI data.
gNMI uses a client-initiated Subscribe RPC. After the subscription is established, the device publishes updates according to the requested mode:
sample: periodic updates at the configured interval.
on_change: updates only when a value changes (optionally with a heartbeat).
target_defined: device chooses the optimal behavior.
Note
Subscriptions must reference valid YANG paths and, if applicable, the correct module origin. Subscriptions must reference complete YANG paths; wildcards are not supported.
Telegraf has a gNMI plugin that will take care of the subscription and the input section looks like the code below. Note that the subscription port is defined within the addresses section.
The following example subscribes to two paths and writes to InfluxDB. Adjust origins, paths, TLS files, and intervals to the target environment.
Refer to InfluxDB Configuration for more details on how to configure influxdb3 and how to set up $INFLUXDB3_AUTH_TOKEN variable.
[agent]
 debug = true
 # logfile = "/tmp/telegraf.log"     # empty = log to stdout
 # logfile_rotation_interval = 3600


# --- gNMI input: Telegraf will SUBSCRIBE to ypgnmi-app ---
[[inputs.gnmi]]
  # gNMI server (ypgnmi-app)
  addresses   = ["localhost:10161"]

  # TLS settings
  tls_enable  = true
  tls_ca      = "$HOME/certs/ca.pem"
  tls_cert    = "$HOME/certs/client.crt"
  tls_key     = "$HOME/certs/client.key"

  ## redial in case of failures after
  redial      = "10s"

  ## gNMI encoding requested (one of: "proto", "json", "json_ietf", "bytes")
  encoding    = "json"

  # --- Subscriptions (examples) ---

  # On-change subscription for specific leaf (example path; adjust to your YANG)
  [[inputs.gnmi.subscription]]
    name               = "count"
    origin             = "testmod"
    path               = "/sample_container/sample_list[name=name1]/sample_container2/count"
    subscription_mode  = "on_change"

  # Periodic sampling of counters (example path; adjust to your YANG)
  [[inputs.gnmi.subscription]]
    name               = "count2"
    origin             = "get2-counter"
    path               = "/get2-leaf"
    subscription_mode  = "sample"
    sample_interval    = "30s"

# --- Output: InfluxDB (optional, if you want to forward immediately) ---
# Comment this block out if you only want to print to stdout for testing.
[[outputs.influxdb_v2]]
  urls         = ["http://127.0.0.1:8181"]
  token        = "${INFLUXDB3_AUTH_TOKEN}"
  organization = ""
  bucket       = "telemetry"

# For dry-run testing without InfluxDB, uncomment to print metrics:
[[outputs.file]]
  files          = ["stdout"]
  flush_interval = "10s"
# EOF
InfluxDB
InfluxDB is a time-series database optimized for high-volume writes and time-based queries. It stores telemetry data points in buckets, supports retention policies, and exposes authentication via tokens that can be scoped to read or write permissions. Query options include InfluxQL or SQL interfaces.
Design guidance:
Create a dedicated organization and a telemetry bucket with an appropriate retention period.
Use a write-only token for Telegraf and a read-only token for Grafana.
Adopt a consistent measurement and tag schema to control cardinality.
Use separate buckets for high-rate raw data and down-sampled roll-ups if long-term retention is required.
InfluxDB Installation
Installation options include native packages, containers, and the InfluxDB 3 Core installers. Follow the Official Installation Steps for complete installation procedure.
Recommended workflow:
Install the server and complete the initial setup in the UI or with the CLI (create organization, bucket, and an initial admin token).
Create a narrow write token for the telemetry bucket and a narrow read token for Grafana.
After installing InfluxDB 3 Core verify the installation - enter the following command to verify that it installed successfully:
influxdb3 --version
InfluxDB Configuration
The following procedure starts InfluxDB 3 Core on loopback for local testing, creates an operator token, provisions a database, and configures Telegraf to write to it.
Pre-requisites
InfluxDB 3 Core CLI (influxdb3) installed and available in PATH.
Telegraf installed.
TCP port 8181 available on the host.
1) Start the InfluxDB 3 Core server (loopback)
Bind to loopback during initial testing so external hosts cannot connect.
influxdb3 serve \
  --http-bind 127.0.0.1:8181 \
  --node-id node0 \
  --object-store file \
  --data-dir /var/lib/influxdb3
A healthy startup prints multiple INFO lines and does not report Failed to bind address. Keep this process running.
Omitting --http-bind binds the HTTP listener to 0.0.0.0:8181 (all interfaces). Use this only when external access is required and appropriate network controls are in place.
2) Create the operator (admin) token
Open a separate terminal and create an operator token:
# operator (admin) token - prints once; save it
influxdb3 create token --admin --host http://127.0.0.1:8181
Copy the apiv3... token it prints. For convenience in this shell:
export INFLUXDB3_AUTH_TOKEN='apiv3_YOUR_TOKEN_HERE'
Note
The operator token grants full privileges. Rotate and store it according to local security policy.
3) Create the database for Telegraf writes
influxdb3 create database telemetry \
  --host http://127.0.0.1:8181 \
  --token "$INFLUXDB3_AUTH_TOKEN" \
  --retention-period 30d
Quick health checks:
curl -s http://127.0.0.1:8181/health
influxdb3 show databases --host http://127.0.0.1:8181 --token "$INFLUXDB3_AUTH_TOKEN"
4) Configure Telegraf to write to InfluxDB 3 Core
Only the InfluxDB output block is required for v3 Core (the v2 write API is used under the hood). Ensure the database name matches the value created above.
[[outputs.influxdb_v2]]
  urls         = ["http://127.0.0.1:8181"]
  token        = "apiv3_YOUR_TOKEN_HERE"   # or use ${INFLUXDB3_AUTH_TOKEN}
  organization = ""
  bucket       = "telemetry"               # must match the DB you created
Restart Telegraf and verify that batches are written without HTTP errors in the Telegraf logs.
Note
In InfluxDB 3 Core, bucket corresponds to the database name, and organization is empty. Use of an environment variable (for example, INFLUXDB3_AUTH_TOKEN) is recommended to avoid storing the token in cleartext within configuration files.
Grafana
Grafana provides dashboards, ad-hoc exploration, and alerting. Add an InfluxDB data source that matches the server version and query language in use. Supply the URL, organization (if applicable), and a read token with the minimal scope required for the target bucket. Build dashboards using variables such as device name, interface, and measurement to enable reuse across nodes and easy filtering.
Design guidance:
Use time-series panels with transformations that are appropriate for the data (for example, rate or non-negative derivative for counters).
For on_change streams, include a "last value" panel and consider heartbeat or fill logic for readability.
Store dashboards in version control or export JSON snapshots to maintain change history.
Grafana Installation
Grafana can be installed through native packages, containers, or a managed cloud service. Follow the Official Installation Steps for complete installation procedure.
After installation, secure the admin account, restrict network access to the UI, and provision the InfluxDB data source and starter dashboards.
Grafana Configuration
Pre-requisites:
Grafana 12.2 or later
Administrator role in Grafana
InfluxDB token with read access to the database
Quick reference: InfluxDB 3 Core configuration
Configuration |
Value |
|---|---|
Product selection |
InfluxDB Enterprise 3.x (currently, no Core menu option) |
URL |
Server URL - for example, https://127.0.0.1:8181 |
Query languages |
SQL (requires HTTP/2), InfluxQL |
Authentication |
Admin token (if authentication is enabled) |
Database/Bucket |
Database name ('telemetry' as setup in InfluxDB Configuration) |
Refer to the Grafana official documentation that provides instructions for configuring the InfluxDB data source and explains the available configuration options on how to Configure the InfluxDB data source
Also, refer to the InfluxDB documentation in order to identify the product version of a InfluxDB instance and other configuration details, Use Grafana to visualize data
Grafana Troubleshooting
If the Save and Test action returns an error, consider the following.
When Grafana Cloud is used, Private data source connect (PDC) must be
configured and an agent must be attached to a PDC network. Because InfluxDB runs
on the local host, Grafana Cloud cannot reach 127.0.0.1 directly; a secure
tunnel must be established from the local network to Grafana Cloud via the PDC
agent.
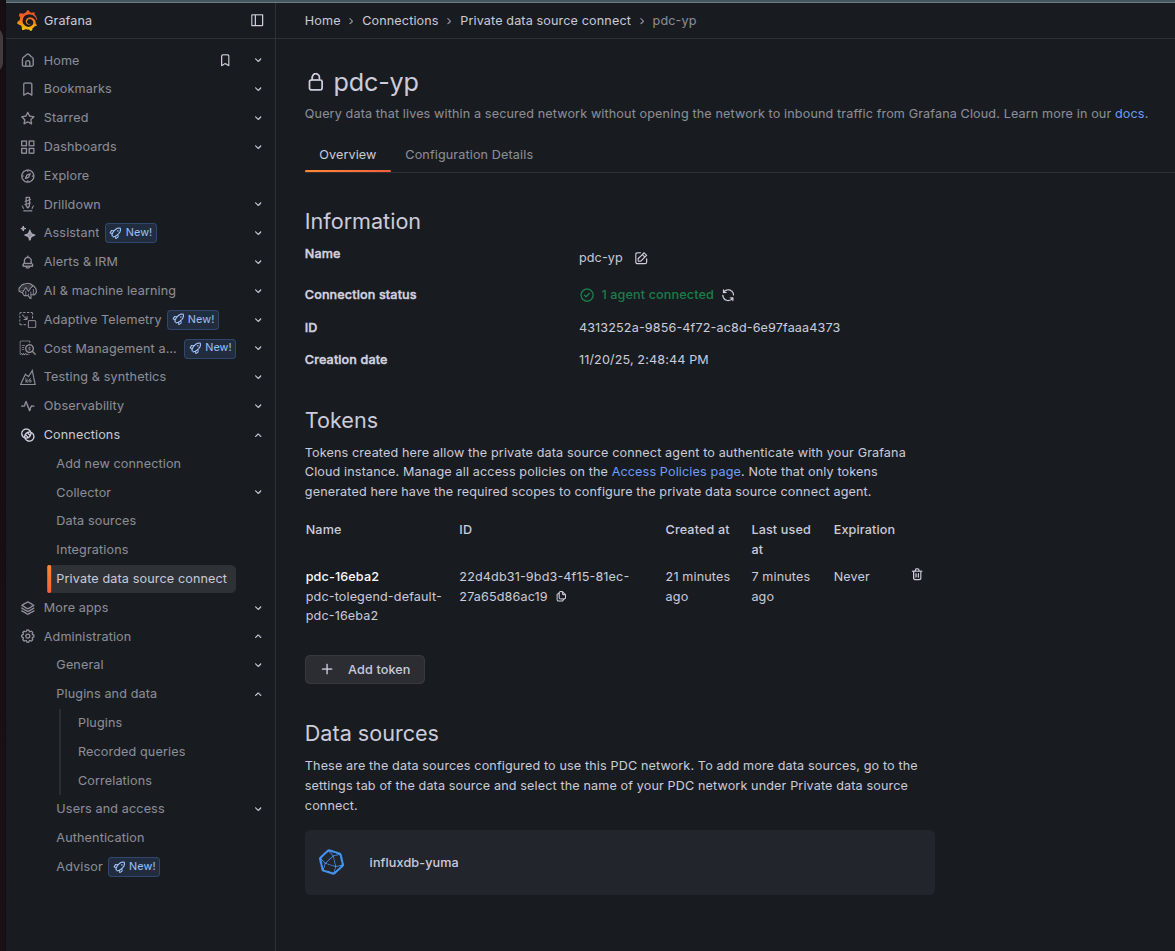
1) Attach an agent to the existing PDC network
In Grafana Cloud, navigate to: Connections -> Private data source connect -> select an existing network (or create a new one) -> Configuration details.
Choose an installation method and use the exact command provided by Grafana. The Docker method is typically the most direct:
Click Create a new token (or Use an existing token if already created) and copy the token.
Run the docker run ... pdc command Grafana shows (on the same machine that can reach InfluxDB at
127.0.0.1:8181).
Note
When the PDC agent runs in Docker,
127.0.0.1inside the container refers to the container itself, not the host where InfluxDB is listening. Configure the container so that the agent can reach the host’s InfluxDB. The simplest approach on Linux is to start Docker with host networking:sudo docker run --name pdc-agent --network host \ grafana/pdc-agent:latest \ -token <YOUR_PDC_TOKEN> \ -cluster prod-us-west-0 \ -gcloud-hosted-grafana-id 1428525
After approximately 10–30 seconds, select Test agent connection in the PDC page. The page should report 1 agent connected.
Note
Run the agent on the same host as InfluxDB when the data source URL is
http://127.0.0.1:8181. If the agent runs on a different host, use the
InfluxDB address reachable from that host (for example, the server’s LAN IP)
rather than 127.0.0.1.
After successful configuration, the PDC page may appear as follows:
2) Bind InfluxDB data source to PDC network
Open the InfluxDB data source in Grafana Cloud (Connections -> Data sources -> data source).
Under Private data source connect, select the PDC network to which the agent is attached (the dropdown lists connected networks). Save the configuration.
3) Fill the InfluxDB fields correctly (InfluxQL first - simplest)
- URL and auth:
Product: InfluxDB Enterprise 3.x
Query language: InfluxQL
- Database settings:
Database: telemetry (this is the v3 database name)
User: any non-empty string (e.g., grafana)
Password: paste the apiv3... token (just the token, no "Bearer ")
HTTP method: POST
Refer to the illustration here:
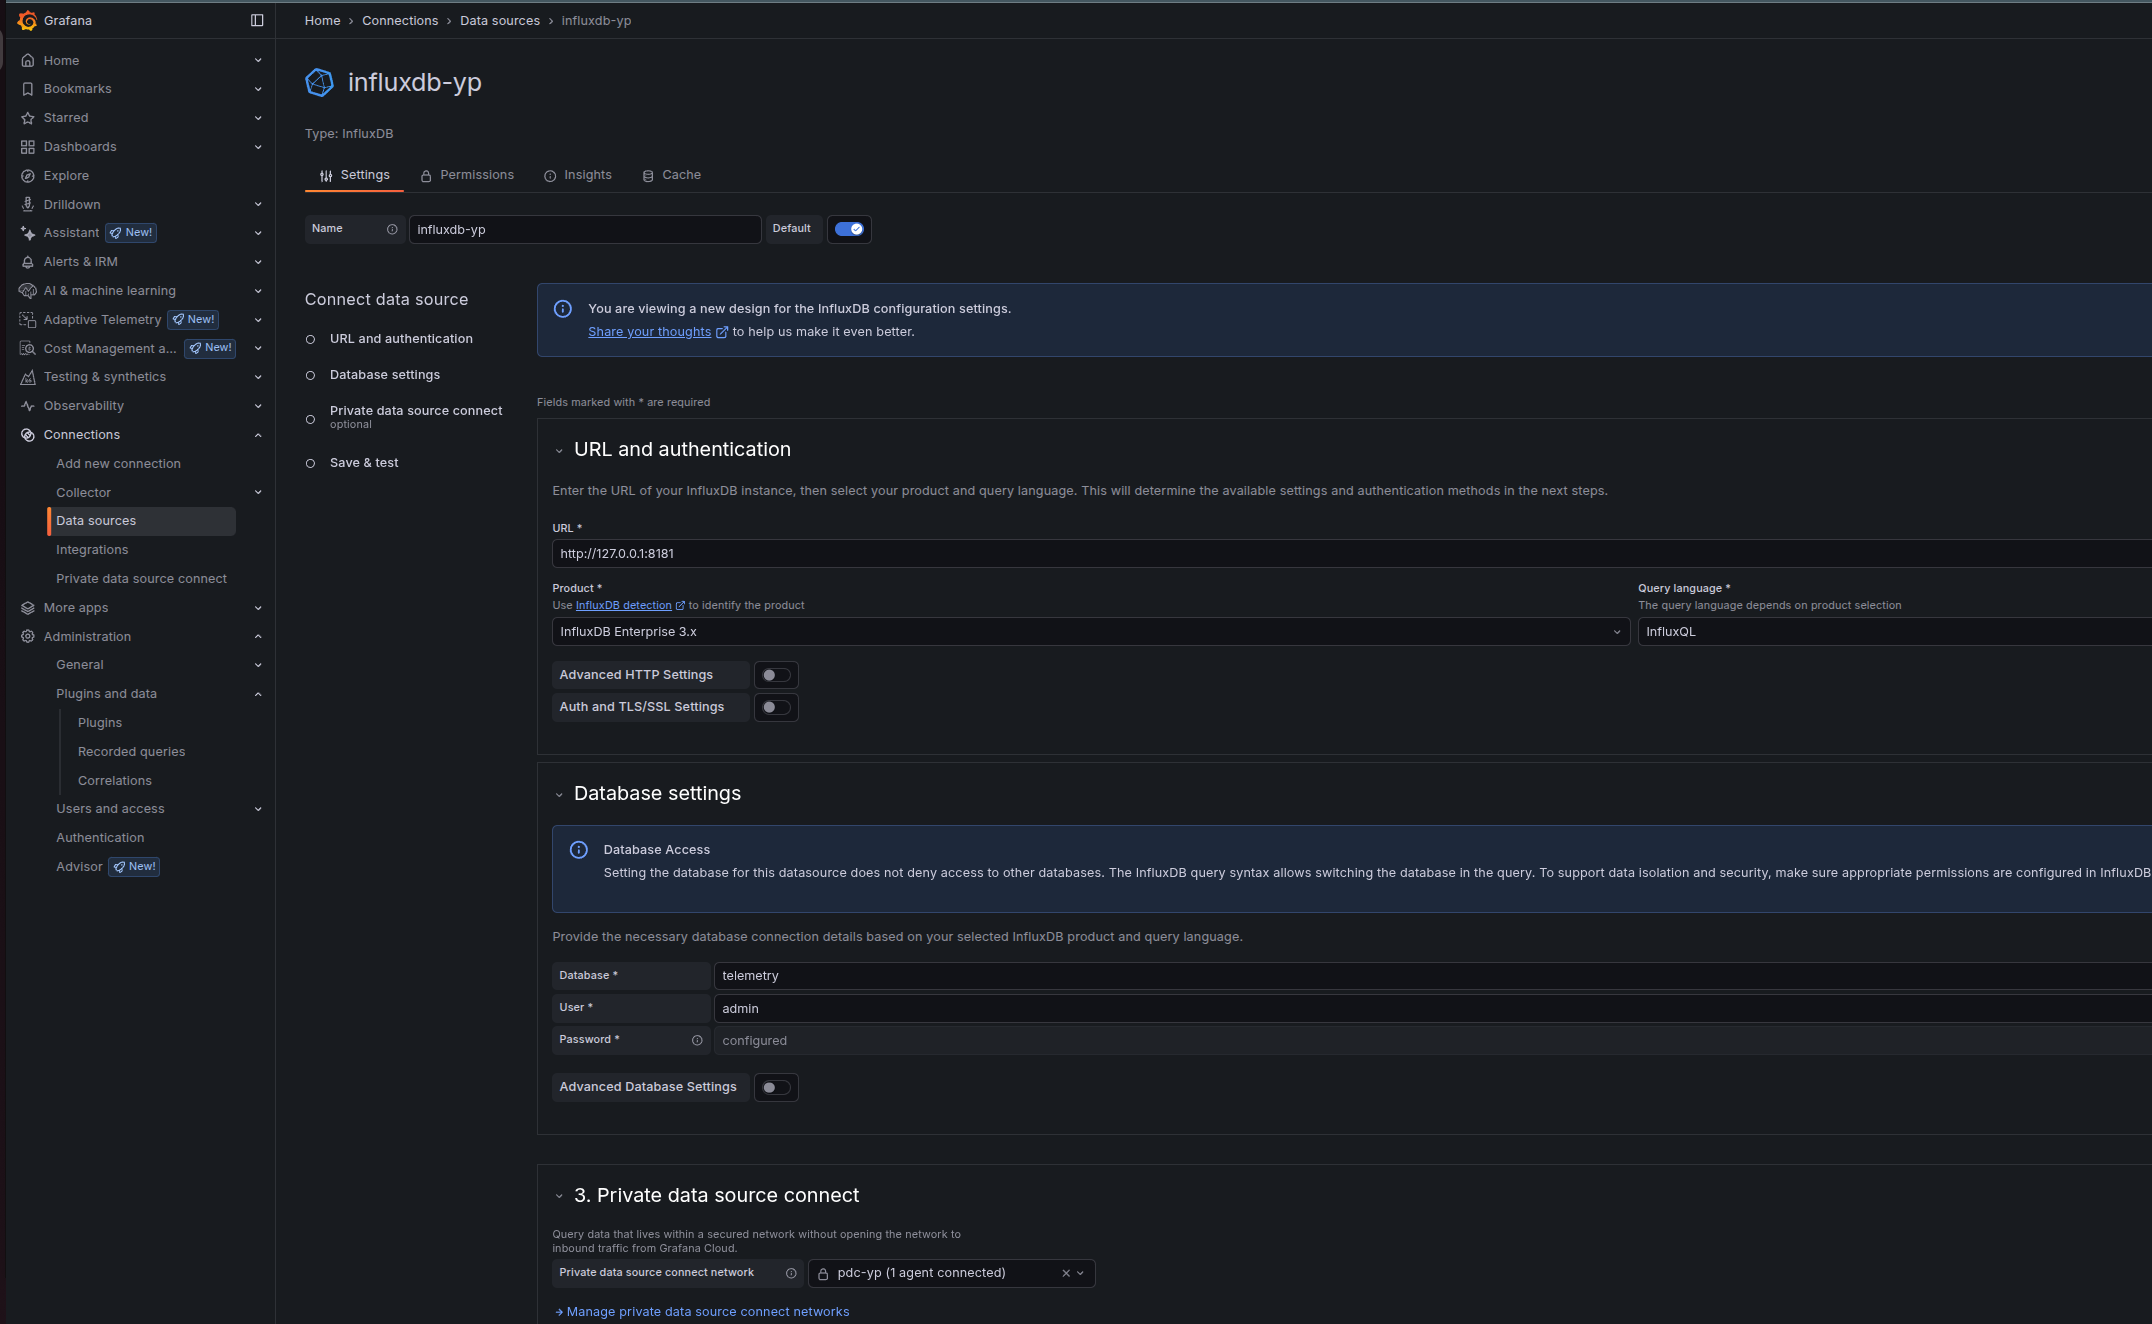
Click Save and test -> it should succeed.
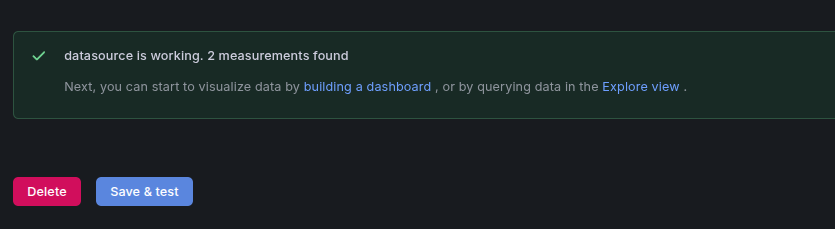
Next, start to visualize data by building a dashboard, or by querying data in the Explore view.
For SQL queries: create a second data source with Query language = SQL, set Database = telemetry, put the apiv3... token in the Token field, and enable Advanced Database Settings -> Insecure connection if plain HTTP is used. SQL uses Flight SQL (gRPC) over HTTP/2.
Grafana Visualizations
Refer to the Grafana official documentation for step-by-step guidance on creating panels and dashboards that visualize data coming from InfluxDB. Visualize data
After completing the data source configuration and building a dashboard, a panel similar to the following can be observed:
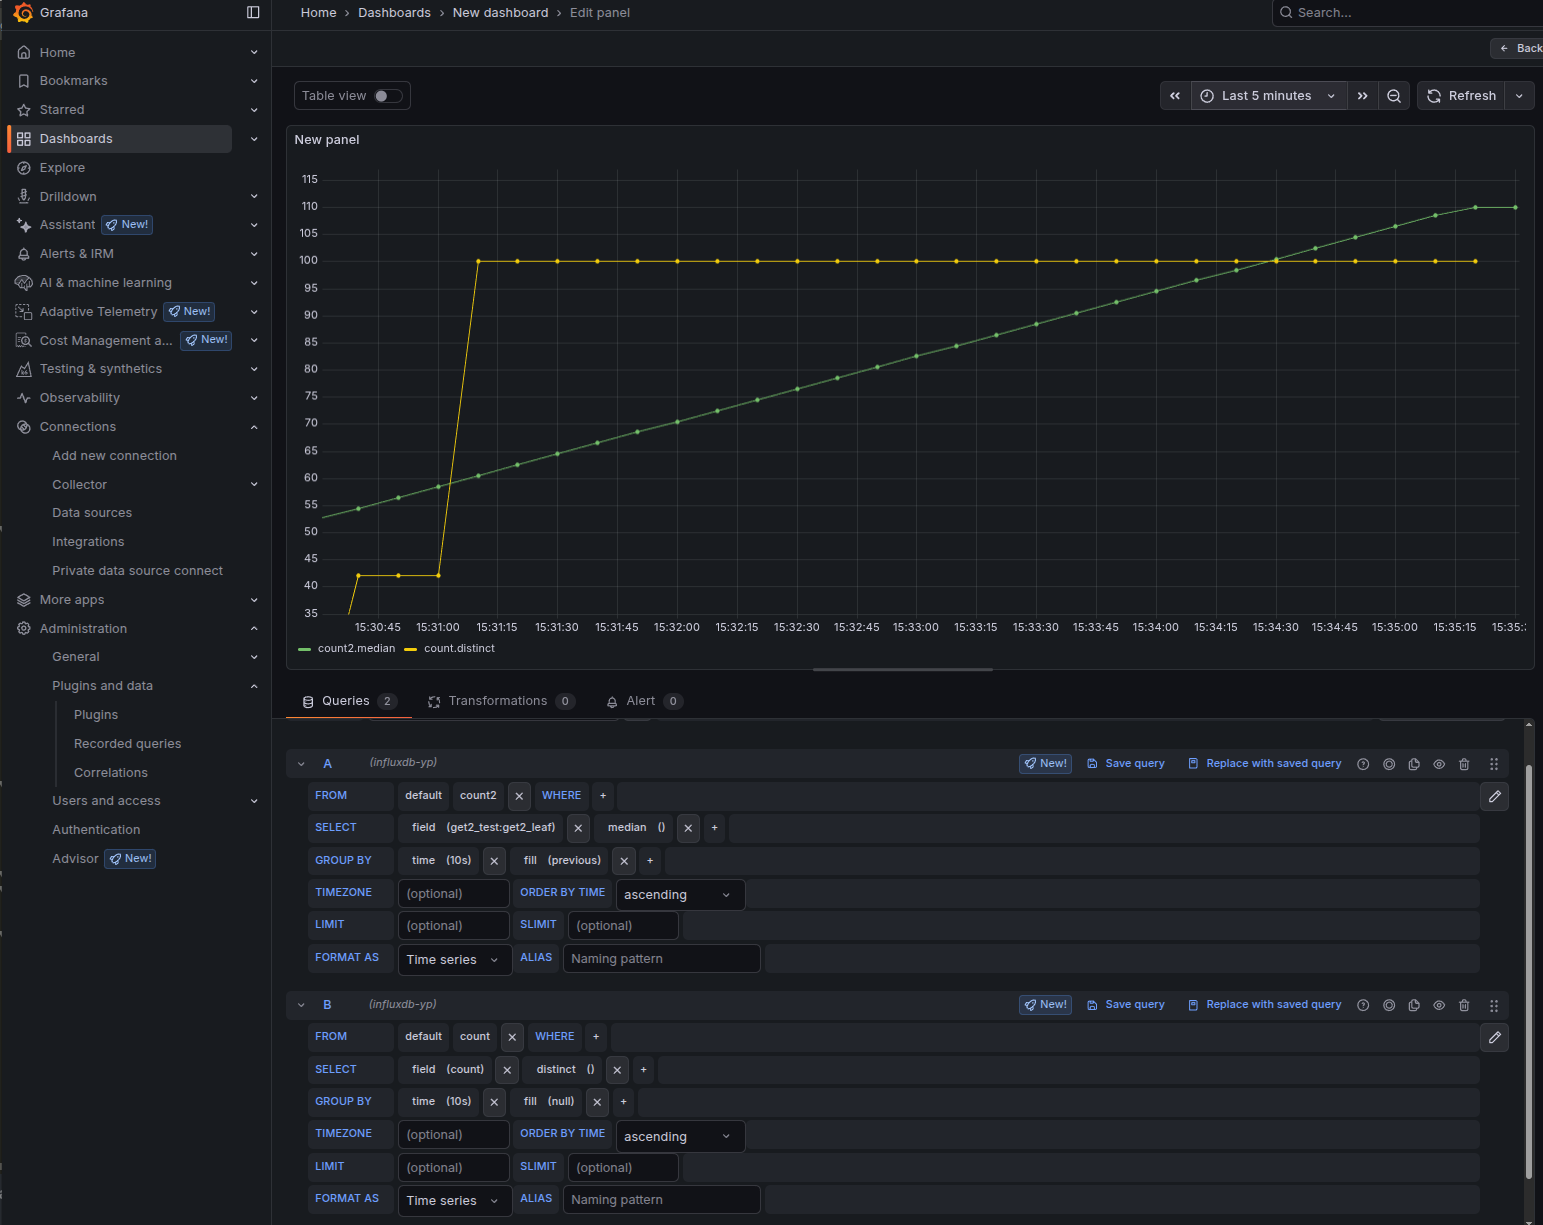
Interpretation of the panel:
The on-change subscription (shown as the green series in this example) was triggered three times when the count value changed to 13, 42, and 100.
The sampled subscription (shown as the yellow series) updates at the configured interval - every 30 seconds - and reflects the current value at each sample time.
This panel is driven by the following Telegraf gNMI subscriptions:
# On-change subscription for specific leaf
[[inputs.gnmi.subscription]]
  name               = "count"
  origin             = "testmod"
  path               = "/sample_container/sample_list[name=name1]/sample_container2/count"
  subscription_mode  = "on_change"

# Periodic sampling of counters
[[inputs.gnmi.subscription]]
  name               = "count2"
  origin             = "get2-counter"
  path               = "/get2-leaf"
  subscription_mode  = "sample"
  sample_interval    = "30s"
TPG - Telegraf, Prometheus, and Grafana
The TPG stack is appropriate where Prometheus is the standard time-series database or where a pull-based model is required by policy. Telegraf performs the gNMI subscription against ypgnmi-app and exposes a Prometheus-compatible endpoint for scraping, or alternately sends data via remote_write. Grafana provides visualization and alerting.
Typical pattern:
Telegraf subscribes to ypgnmi-app and converts updates to metrics.
Telegraf's Prometheus client output exposes metrics on a local port.
Prometheus scrapes Telegraf at a configured interval.
Grafana queries Prometheus for dashboards and alerting.
Prometheus
Prometheus is an open-source monitoring system and time-series database optimized for numeric metrics and low-latency queries.
In the telemetry stacks described here, Prometheus is the primary datastore in the TPG stack.
Refer to the official documentation for details about Prometheus.
Prometheus Installation
Prometheus can be installed through native packages or containers. Follow the Official Installation Steps for complete installation procedure.
Prometheus Configuration
Prometheus is configured via command-line flags and a configuration file. While the command-line flags configure immutable system parameters (such as storage locations, amount of data to keep on disk and in memory, etc.), the configuration file defines everything related to scraping jobs and their instances, as well as which rule files to load. Follow the Configuration for more details.
1. Telegraf Configurations
Telegraf exposes /metrics for Prometheus to scrape:
[[outputs.prometheus_client]]
listen = "0.0.0.0:9273" # bind as needed; 127.0.0.1 for local-only
path = "/metrics"
expiration_interval = "5m" # time to keep series without updates
metric_version = 2 # Prometheus exposition format
# Optional constant labels:
# string_labels = { stack="tpg", site="lab" }
2. Prometheus Configurations
A minimal Prometheus configuration that scrapes Telegraf every 10 seconds:
global:
  scrape_interval: 10s
  evaluation_interval: 10s

scrape_configs:
  - job_name: 'telegraf-gnmi'
    metrics_path: /metrics
    static_configs:
      - targets: ['127.0.0.1:9273'] # adjust if Telegraf listens elsewhere
        labels:
          source: 'ypgnmi-app'
3. Grafana Configurations
Add a Prometheus data source:
URL: Prometheus HTTP endpoint (for example, http://127.0.0.1:9090).
Save & test.
Adjust the series names to match the metrics generated by Telegraf (measurement and field names become metric names; tags become labels). Use Variables in Grafana (for example, device, origin, or list key) to parameterize dashboards.
This completes the TPG stack setup: Telegraf collects and exposes metrics, Prometheus scrapes and stores, and Grafana visualizes and alerts.
TICK - Telegraf, InfluxDB, Chronograf and Kapacitor
The TICK stack uses InfluxDB for storage, Chronograf for data exploration and dashboards, and Kapacitor for stream/threshold processing and alerting.
Chronograf and Kapacitor are legacy components of the TICK stack (InfluxDB 1.x era). They are not recommended for new, InfluxDB 3–based telemetry pipelines.
It is recommended to replace Chronograf dashboards with Grafana dashboards.
Kafka Integration
Kafka is an optional decoupling/collection component; the base stacks do not require it.
Kafka provides a durable, horizontally scalable commit log that decouples telemetry producers (gNMI via Telegraf) from consumers (InfluxDB 3, Prometheus, stream processing).
In this architecture, Kafka is typically used to buffer bursty on-change updates, fan out the same stream to multiple analytic backends, and support replay for troubleshooting and offline processing.
Follow the Kafka Quick start Guide for more details.
gNMIc Integration
gNMIc is an optional decoupling/collection component; the base stacks do not require it.
gNMIc can sit between ypgnmi-app (gNMI server) and Kafka, then either write directly to InfluxDB or it can consume from Kafka and forward to InfluxDB (and view in Grafana).
gNMIc natively supports Kafka output, Kafka input, InfluxDB output, and both Prometheus scrape and remote_write paths, so it covers TIG and TPG style pipelines cleanly.
Recommended architectures:
Direct (no Kafka): ypgnmi-app -> gNMIc (subscribe) -> InfluxDB -> Grafana. Fastest to stand up; good for smaller/lab setups. gNMIc has a first-class InfluxDB output. Refer to the gNMIc Influxdb User Guide for more details.
With Kafka (decoupled & scalable): ypgnmi-app -> gNMIc (subscribe) -> Kafka -> {gNMIc consumer -> InfluxDB} -> Grafana. Kafka provides buffering, fan-out, and replay. gNMIc can produce to Kafka and a separate gNMIc (or Telegraf) can consume from Kafka and write to InfluxDB 3 Core (via the v2 write API). Refer to the gNMIc Kafka User Guide for more details.
Prometheus path (TPG): ypgnmi-app -> gNMIc (prometheus scrape output or remote_write) -> Prometheus/Mimir -> Grafana. Use when PromQL and the cloud-native metrics ecosystem are preferred. Refer to the gNMIc Prometheus User Guide for more details.